

Two campaigns. One produces leads at £50, the other at £100. Almost everyone instinctively prefers the first. Often that instinct is wrong, because cost per lead tells you what you paid, not what you got. To know which campaign makes more money, you need three more numbers: how many leads are genuine, how many of those book, and what a booked job is worth after costs.
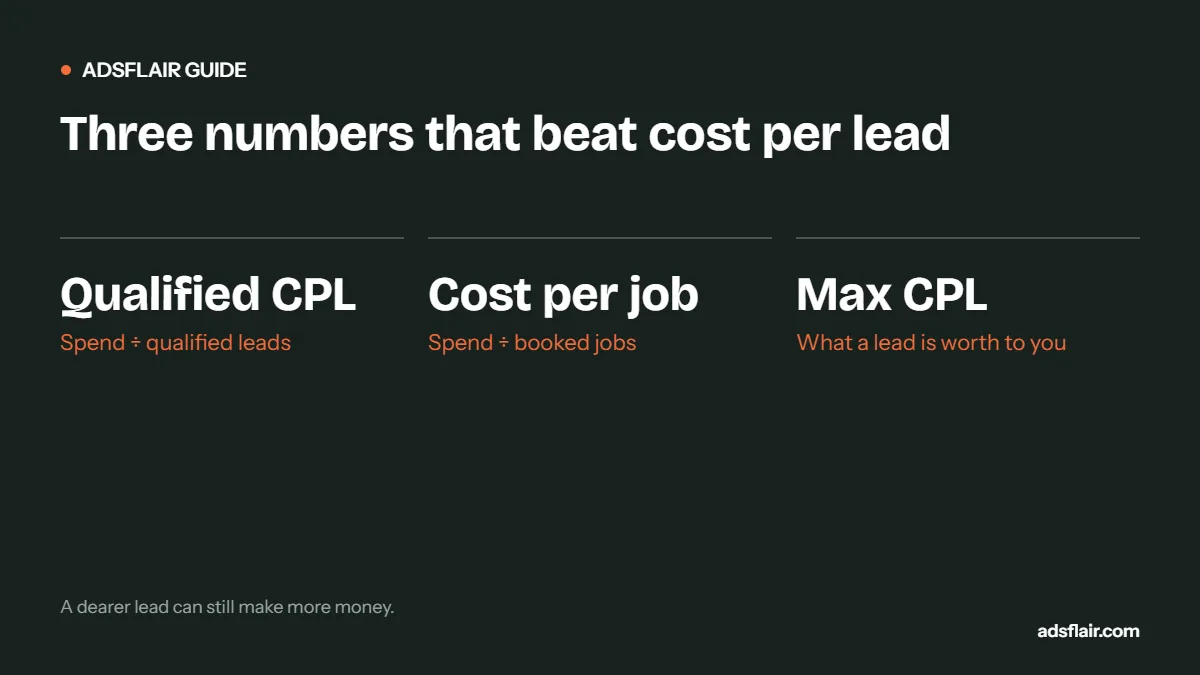
Three numbers that matter more than cost per lead
- Qualification rate: the share of leads that are genuine prospects (right area, right service, contactable).
- Booking rate: the share of qualified leads that become paying jobs.
- Gross profit per job: the job value minus materials, labour and other direct costs.
Qualified cost per lead = spend ÷ qualified leads
Cost per booked job = spend ÷ booked jobs
Profit per lead = (gross profit per job × booking rate × qualification rate) → cost per lead
The worked comparison
| Campaign A: £50 leads | Campaign B: £100 leads | |
|---|---|---|
| Spend | £2,000 | £2,000 |
| Leads | 40 | 20 |
| Qualified (A 50%, B 85%) | 20 | 17 |
| Qualified cost per lead | £100 | £118 |
| Booked (A 30%, B 45% of qualified) | 6 | 8 |
| Cost per booked job | £333 | £250 |
| Average job value | £900 | £1,800 |
| Gross profit per job (40% margin) | £360 | £720 |
| Gross profit from ads | £2,160 | £5,760 |
| Profit after ad spend | £160 | £3,760 |
Illustrative example, not a benchmark.
Campaign A produces twice the leads and barely covers its costs. Campaign B costs twice as much per lead and makes over twenty times the profit. The £100 leads were in-area, wanted higher-value work and booked more often. That pattern is common when one campaign targets broad, cheap searches and the other targets specific, high-intent ones.
Why cheap leads are often worse
- Broader searches. Cheaper keywords are often less specific: "plumber" rather than "bathroom installation [town]".
- Lower-value jobs. Small jobs have lower click prices and lower margins.
- Easier forms. One-tap forms and low-friction pages lift volume and lower quality.
- Platform optimisation. Automated bidding finds the cheapest conversions it can, which are rarely the best customers unless you tell it which ones booked.
Why expensive leads are sometimes worse too
The point is not that dearer is better. A £100 lead can be poor if the keyword is competitive but vague, the landing page is weak or calls go unanswered. The point is that cost per lead alone cannot tell you. Published research on lead response helps explain why identical leads produce different results: firms contacting leads within an hour were nearly seven times as likely to qualify them as firms waiting an hour longer (Harvard Business Review, 2011, as reported by SmartCompany). Two campaigns with the same leads can have very different booking rates depending on who answers.
How to work out your maximum cost per lead
Turn the formula around to find the most you can afford per lead while still hitting a target profit:
Illustrative example. Replace with your own figures.
Many businesses aim to spend no more than a third to a half of the break-even figure, leaving room for overheads and profit. Trade benchmarks often express this as a target cost per booked job of around 10 to 15% of job value (Trade2Base, 2026).
Using this to manage the account
- Report qualified cost per lead and cost per booked job by campaign every month, alongside cost per lead.
- Move budget towards the campaign with the highest profit after ad spend, not the lowest cost per lead.
- Tell Google which leads were good. Upload qualified leads or booked jobs as offline conversions (GCLID uploads are accepted for 90 days after the click) and make them the primary goal once volume allows.
- Attach job values so bidding can favour bigger jobs.
- Fix the cheapest lever first: response speed and booking rate often improve profit more than any bid change.
Questions to ask your agency
- What is our qualified cost per lead by campaign?
- What is our cost per booked job, and how is it measured?
- Are conversions in Google Ads genuine enquiries, or do they include clicks and short calls?
- Are booked jobs being sent back to Google?
If those questions cannot be answered, the account is being managed on cost per lead, and the cheapest leads will keep winning the budget. For the tracking side, read how to track Google Ads leads through to revenue; for the symptoms, read Google Ads leads but no sales.
The same maths, trade by trade
The comparison looks different for every trade because job values and booking rates vary so much. These examples use round, illustrative figures to show how the decision changes:
| Trade and campaign | Cost per lead | Qualify × book | Profit per job | Profit per lead after ad cost |
|---|---|---|---|---|
| Plumber: emergency leaks | £45 | 80% × 55% = 44% | £110 | £48 − £45 = £3 |
| Plumber: boiler installation | £110 | 75% × 25% = 19% | £1,100 | £209 − £110 = £99 |
| Landscaper: garden tidy-ups | £25 | 60% × 40% = 24% | £120 | £29 − £25 = £4 |
| Landscaper: patios | £85 | 70% × 30% = 21% | £2,400 | £504 − £85 = £419 |
| Roofer: repairs | £60 | 75% × 50% = 38% | £220 | £84 − £60 = £24 |
| Roofer: re-roofs | £140 | 70% × 25% = 18% | £2,200 | £396 − £140 = £256 |
Illustrative figures only. Profit per lead = profit per job × qualify rate × booking rate → cost per lead.
In every pair, the cheaper lead is the less profitable one per lead. That does not mean you should switch off the cheap campaign. It means you should know what each one is for.
When the cheaper campaign is still worth running
- It fills quiet weeks. If engineers would otherwise be idle, the marginal profit from small jobs is higher than the table suggests, because wages are already paid.
- It feeds repeat work. A £120 boiler service customer who comes back for a £3,000 installation two years later is worth far more than the first invoice. Track repeat customers by original source and include their value.
- It builds reviews. Small jobs done well generate reviews that lift conversion on every other campaign.
- It protects your patch. Being visible for everyday searches keeps your name in front of local customers.
The test is simple: if a cheap-lead campaign is not doing at least one of these jobs, and its profit after ad spend is close to zero, reduce it and move budget to the work that pays.
Setting up the spreadsheet
You do not need software to start. A sheet with one row per enquiry and these columns is enough:
| Column | Example |
|---|---|
| Date | 14/10/2026 |
| Source and campaign | Google Ads, Boiler installation |
| Qualified? | Yes / No (reason) |
| Booked? | Yes / No / Pending |
| Job value | £3,250 |
| Gross profit | £1,150 |
At the end of the month, a pivot table by campaign gives you qualified cost per lead, booking rate, cost per booked job and profit after ad spend. After three months you will have a clear view of which leads make money, and you can stop guessing.
Lifetime value changes the answer again
Some services are worth far more than their first job. Servicing contracts, maintenance plans, regular cleaning and lawn care all bring repeat revenue. If a regular window cleaning customer pays £20 a month for three years, the first booking is worth £720, not £20. For these businesses, judge campaigns on expected customer value, and accept a higher cost per lead where customers tend to stay.
Want this set up and run for you? See our cost per booked job reporting.
Frequently asked questions
Is a lower cost per lead always better in Google Ads?
No. A cheaper lead that rarely qualifies or books can cost more per job and earn less profit than a dearer lead with a higher booking rate and job value.
What is qualified cost per lead?
Ad spend divided by the number of genuine prospects: in area, wanting a service you offer and contactable. It removes spam, wrong numbers and unsuitable enquiries from the calculation.
How do I calculate the maximum I can pay per lead?
Multiply gross profit per job by the share of leads that qualify and the share of qualified leads that book. That is break-even; many businesses target a third to a half of it.
How do I make Google Ads favour profitable leads?
Upload qualified leads or booked jobs with job values as offline conversions, make them the primary goal and, once there is enough data, test value-based bidding.
Related guides
- Google Ads Leads but No Sales?
- How to Track Google Ads Leads to Revenue
- How Much Should a UK Local Business Spend on Google Ads?
Sources
- SmartCompany summary of "The Short Life of Online Sales Leads" (Harvard Business Review, 2011)
- Trade2Base, "Google Ads budget for tradespeople" (8 June 2026)
- Google Ads Help: Offline conversion imports FAQs
Know your real cost per job?
Ask for a free Google Ads review. We will work out your qualified cost per lead and cost per booked job by campaign, and show you where the profit is. You can also see how we run PPC management services.
Get My Free Google Ads Reviewor book a 30-minute call or message us on WhatsApp